
 |
|
| Rating: 4.2 | Downloads: 1,000+ |
| Category: Maps & Navigation | Offer by: Deneb, Jurij Stare, s.p. |
A Light pollution map app is a specialized digital tool designed to visualize and quantify the extent of artificial light emissions across geographical areas. It uses satellite data and ground-based measurements to create interactive maps displaying the intensity and spatial distribution of unwanted nighttime illumination. This resource is invaluable for astronomy enthusiasts, environmental advocates, and anyone seeking to understand or mitigate the negative effects of excessive artificial lighting.
Using a Light pollution map offers significant practical value, especially for stargazers planning observing trips or urban planners aiming to improve night sky visibility and energy efficiency. It provides objective data to identify light-polluted regions versus darker areas, enabling informed decisions about travel, conservation efforts, or lighting design improvements.
App Features
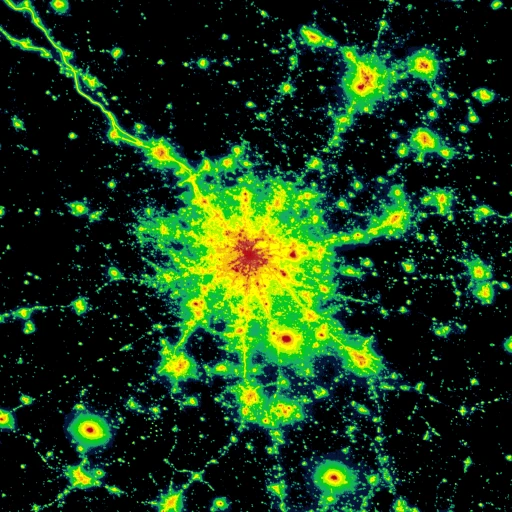
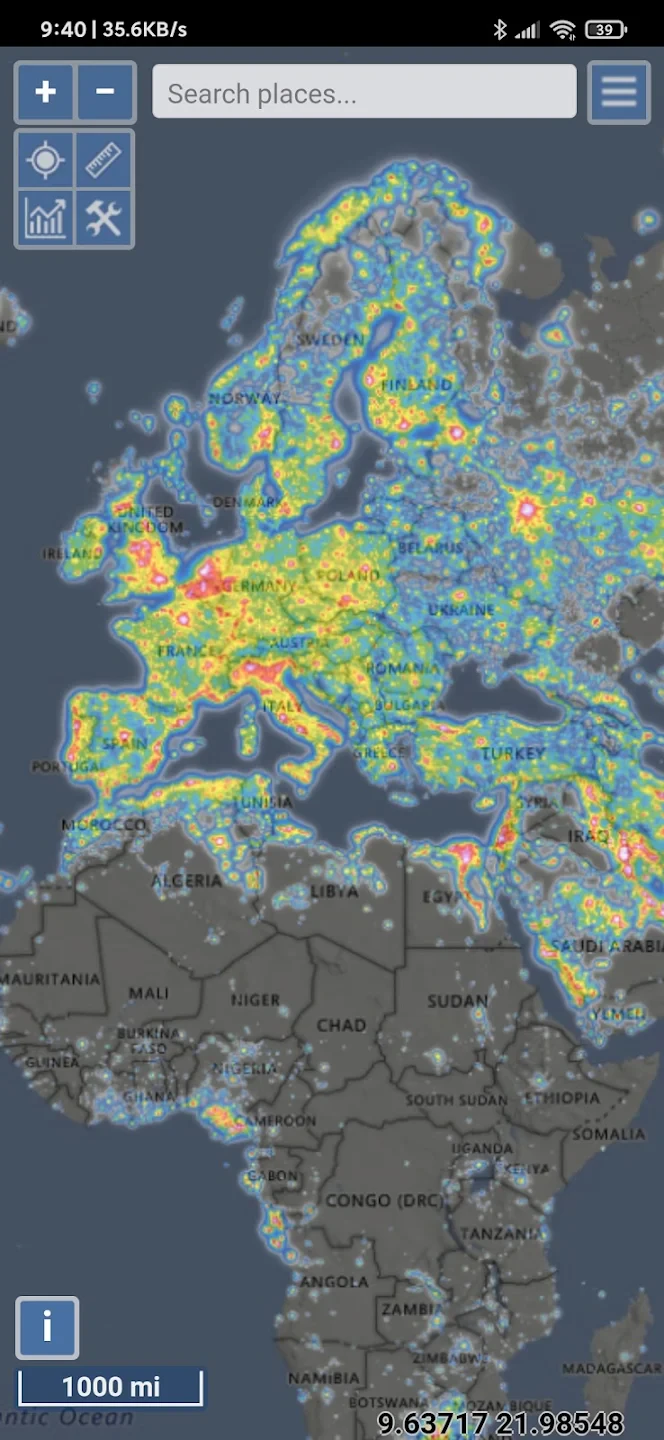
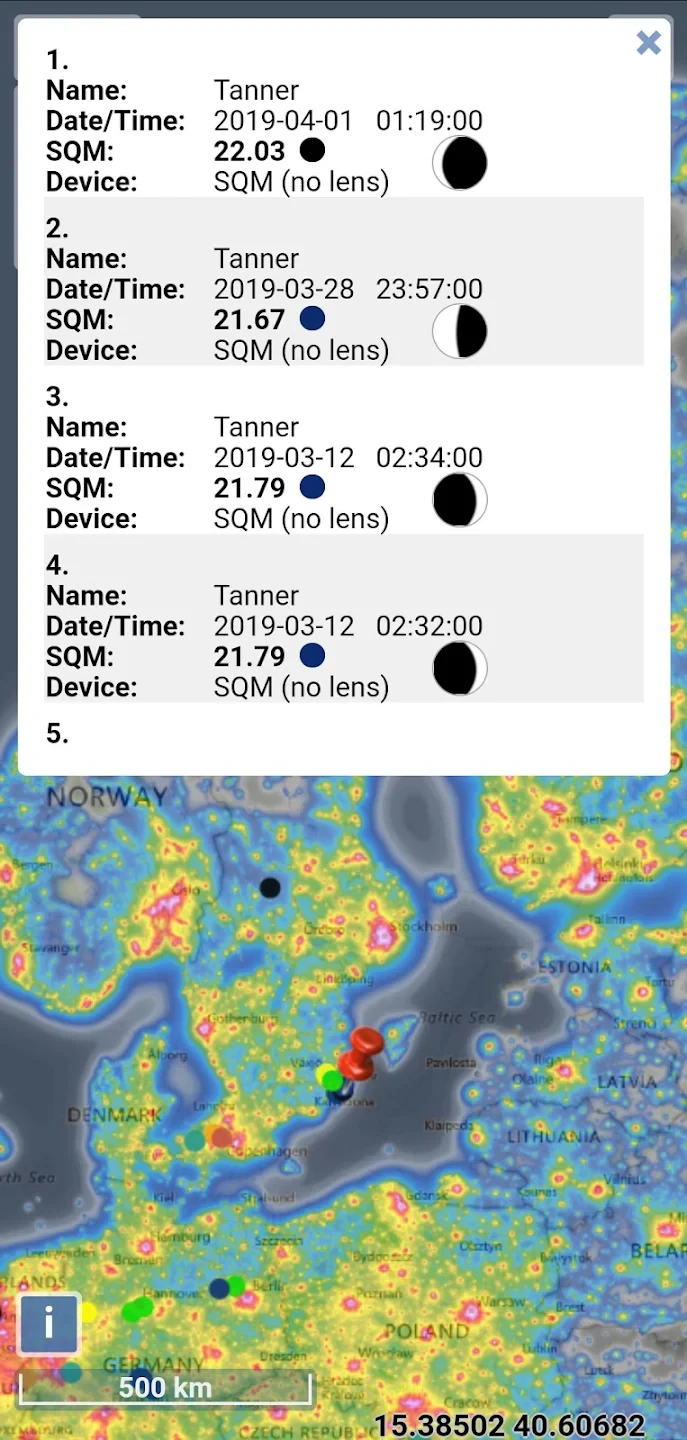
- Night Mode Visualization: Instantly transform daytime maps into detailed night renderings, overlaying light pollution data using intuitive color gradients (typically, darker blues/greys represent minimal light, bright yellows/oranges signify high levels). This feature instantly allows users to see the impact of lighting from their perspective, crucial for planning stargazing excursions or assessing local nighttime conditions.
- Global & Local Data Integration: The app combines data from satellites like VIIRS (Suomi National Polar-orbiting Partnership) with potentially crowdsourced ground measurements and local zoning information. This multi-source approach ensures comprehensive and often near real-time data accuracy across large regions and specific urban areas, providing a detailed and dynamic picture of light pollution.
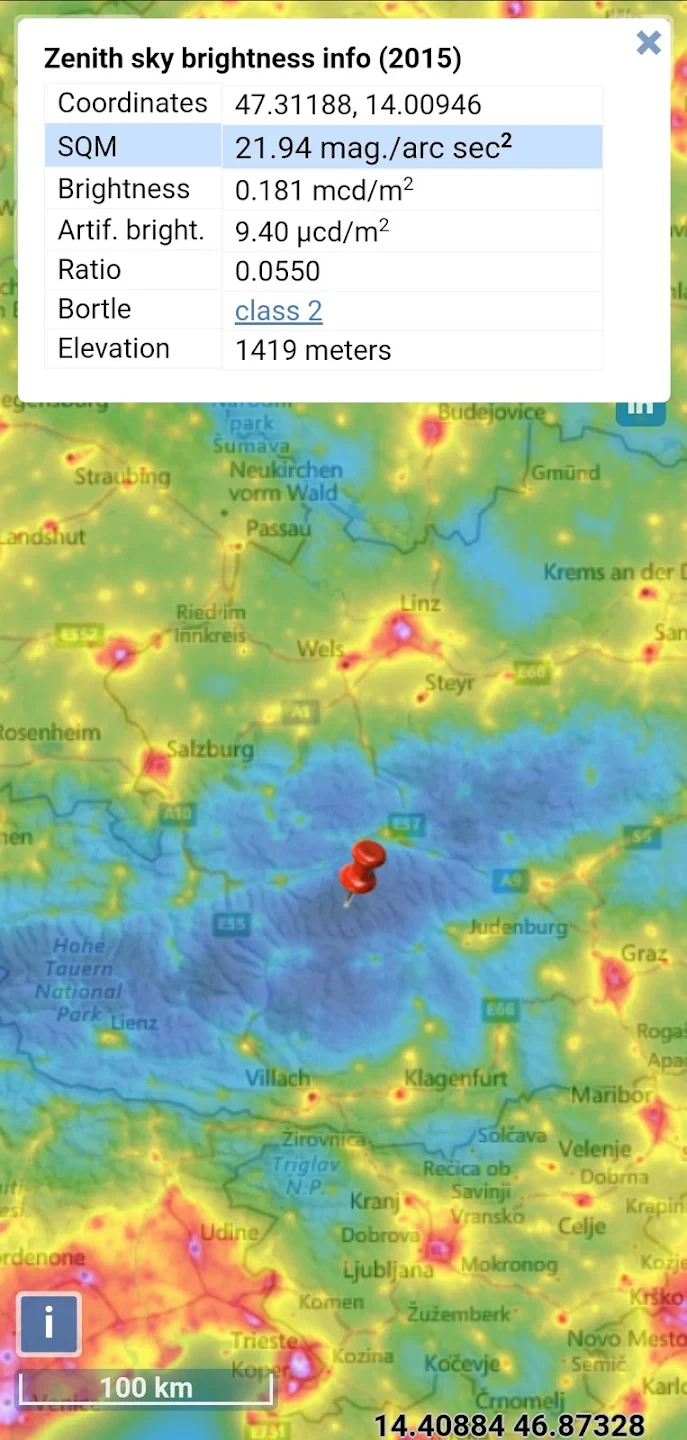
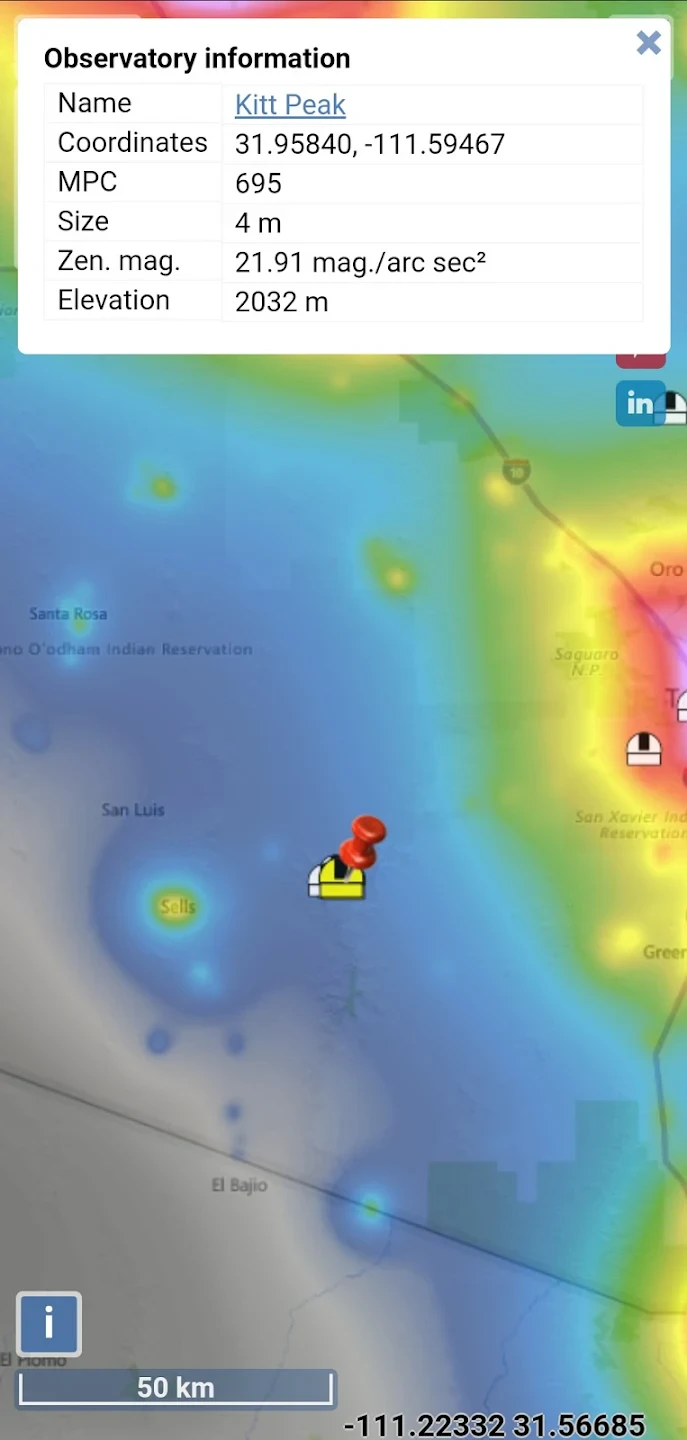
- Dark Sky Identification & Recommendations: By analyzing the light pollution data, users can quickly identify areas designated as International Dark Sky Sites or locate nearby spots with particularly dark skies, often providing details on accessibility and viewing conditions. This feature directly empowers astronomers and nature lovers by pinpointing the best locations for observing stars, planets, and celestial phenomena.
- Layer Switching (Optional/Advanced View): Depending on the app version, users might be able to switch map layers beyond just light pollution intensity, potentially viewing star visibility forecasts, satellite constellations (like Starlink), or population density data. Having these layers enhances the context of light pollution impact, revealing how artificial light correlates with human activity, urban sprawl, or astronomical obstruction.
- Data Comparison & Trends: Many Light pollution map apps offer historical data or the ability to compare current light pollution levels over specific periods (e.g., monthly, yearly). This temporal analysis is key for understanding whether light pollution levels are improving (due to regulations or public awareness) or worsening, providing valuable evidence for advocacy and policy-making efforts.
- Export & Share Functionality (Optional): Users can often download map snapshots, extract light pollution data for specific coordinates, or share relevant sections of the map via email or social media. This feature supports documentation of light pollution hotspots, sharing of valuable stargazing locations with friends, or including visual data in presentations for educational or official purposes.
Pros & Cons
Pros:
- Access to Satellite Data
- User-Friendly Interface
- Global Coverage
- Empowering for Astronomy
Cons:
- Detailed Analysis May Be Limited
- Data Refresh Rate Varies
- Satellite Data Can Have Gaps
- Local Variations May Not Be Captured
Similar Apps
| App Name | Highlights |
|---|---|
| Sky Quality Meter |
This app measures ambient light levels using your phone’s sensors and estimates the astronomical magnitude per square arcsecond (a standard unit for dark sky measurement). Known for portable, real-time measurements and providing feedback based on established dark sky standards. |
| Dark Sky Finder |
A specialized tool focused on locating International Dark Sky Parks, Reserves, Sanctuaries, and Communities. Often includes trip planning features and detailed reviews of designated areas. |
| LightKeeper |
Designed for monitoring light pollution over time and specific locations, offering features for comparing data and generating reports. Includes historical data visualization and tools for analyzing changes in lighting conditions. |
| Stellarium |
A comprehensive astronomy planning app primarily for stargazing. While not a pollution map, many versions integrate visibility indicators for celestial objects based on sky darkness, providing context for when and where best to view them. |
Frequently Asked Questions
Q: How do I interpret the color gradients on the Light pollution map?
A: Light pollution maps typically use color-coded zones. Think of a standard traffic light spectrum: green or dark blue often represents low light pollution (dark sky), amber/yellow indicates moderate levels, and red/orange signifies high levels. This visual language helps you quickly assess the darkness of different areas.
Q: Are Light pollution map apps accurate for my backyard stargazing session?
A: While these apps provide an excellent overview, their accuracy can vary. Satellite-based data might miss localized bright lights or specific features. For precise conditions in a very specific location, using a dedicated Sky Quality Meter app or a handheld photometer often gives the best real-time measurement.
Q: Does a Light pollution map app require an internet connection?
A: Many apps need an internet connection to fetch the latest satellite data, updates, and map layers. However, some may allow limited offline viewing of pre-downloaded data, especially older datasets, but full functionality usually relies on connectivity.
Q: Can a Light pollution map help me choose where to live?
A: Absolutely! A Light pollution map is an invaluable tool for assessing night sky quality in different locations. Areas with high light pollution often correlate with more urban settings, while darker areas typically represent rural or sparsely populated regions. This can significantly impact your quality of life if you value dark skies for relaxation or stargazing.
Q: Why is light pollution a problem anyway?
A: Excessive artificial light, especially blue-rich light directed upwards or unnecessarily bright lighting, disrupts ecosystems, wastes energy, and obscures the natural beauty of the night sky. This impacts wildlife behavior, poses health risks for humans (like affecting circadian rhythms), and diminishes astronomical observation opportunities for everyone.
Screenshots
 |
 |
 |
 |
Light pollution map App Download |
|
|---|---|
 |
 |