
 |
|
| Rating: 4.7 | Downloads: 5,000,000+ |
| Category: Business | Offer by: Microsoft Corporation |
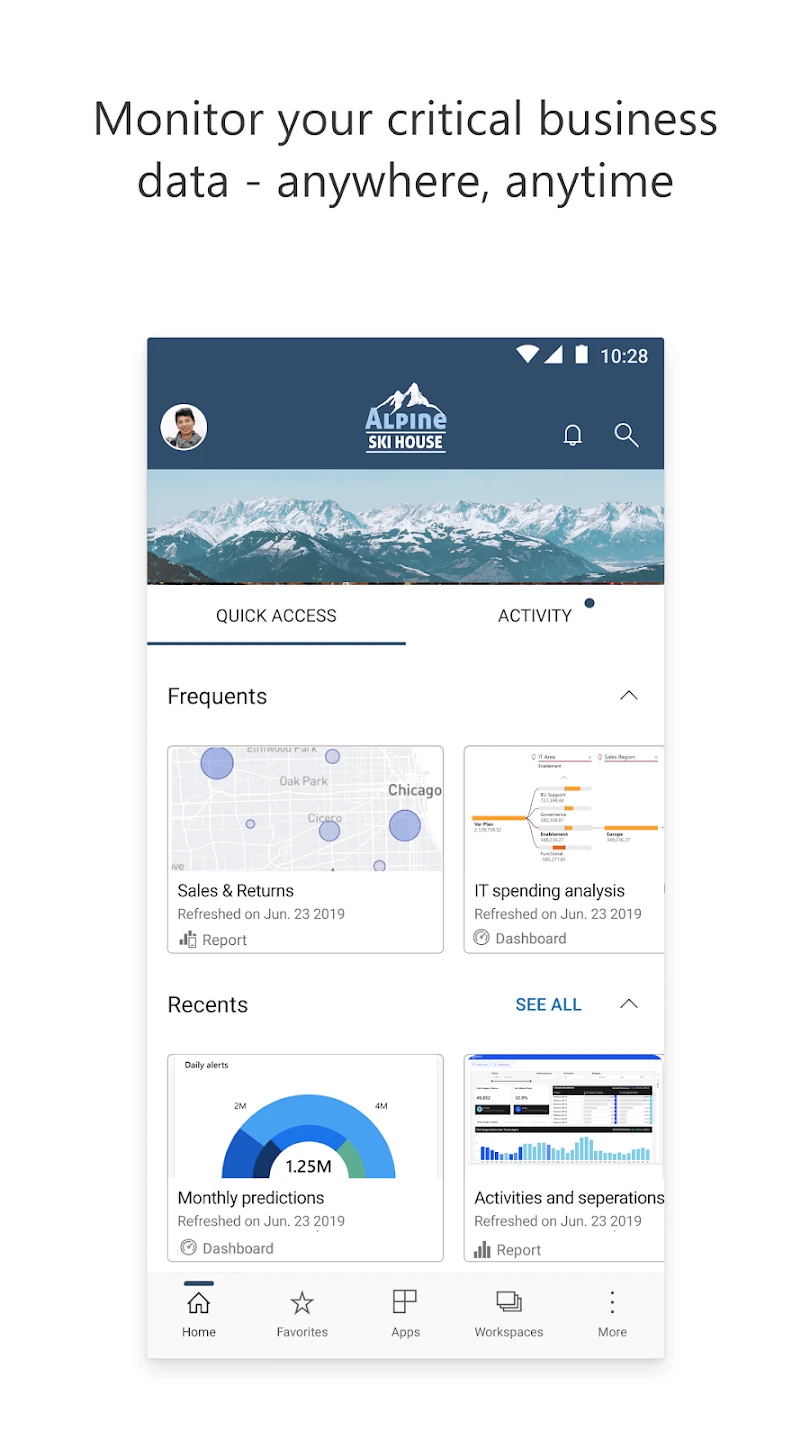
Microsoft Power BI is an analytics service by Microsoft that allows users to connect to data, visualize it, and share insights through interactive dashboards and reports with the app. It enables businesses and individuals to make data-driven decisions by transforming numbers into clear visualizations. The primary audience includes business analysts, data professionals, and managers seeking powerful data analysis tools.
Microsoft Power BI provides a free starting point (Power BI Free) and integrates seamlessly with other Microsoft products like Excel and Azure. Its core appeal lies in simplifying complex data sets into understandable charts, graphs, and reports, empowering users to gain valuable business intelligence and communicate findings effectively.
App Features
- Intuitive Data Import and Connection: Easily connect to a vast array of data sources, from Excel spreadsheets and cloud services to SQL databases, using simple point-and-click actions or built-in wizards. This feature saves significant time compared to manual data entry and allows users to focus directly on analysis, benefiting analysts who need to quickly pull data from various operational systems.
- Powerful Data Modeling and Transformation: Utilize the Power Query Editor to cleanse, shape, transform, merge, and combine data using familiar techniques and formulas like M language expressions. This enables data professionals to handle intricate data preparation tasks efficiently, ensuring data quality and consistency, thereby improving the reliability and accuracy of subsequent reports for everyone involved.
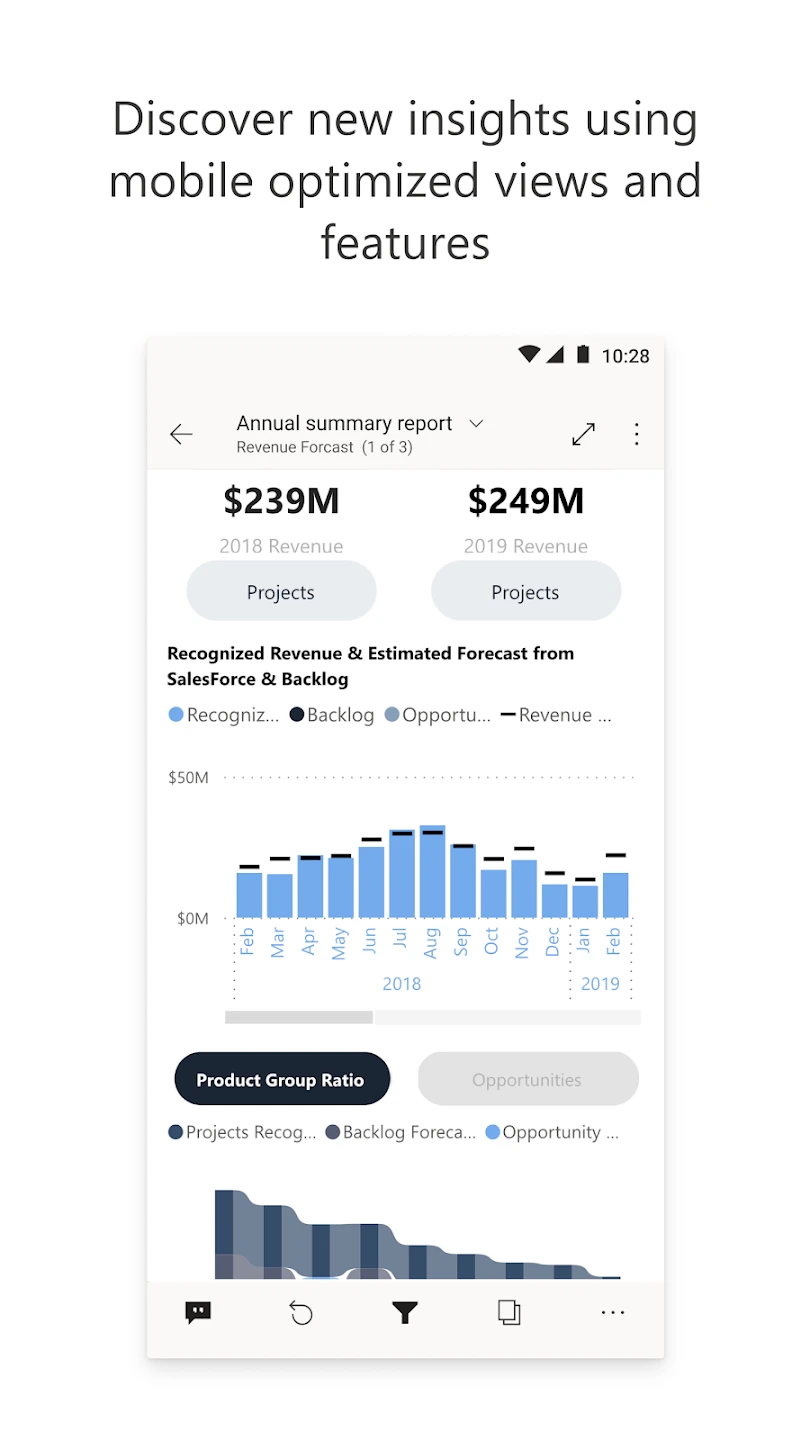
- Interactive Dashboard Creation: Build dynamic dashboards featuring various visualization types like charts, graphs, maps, tables, and KPIs that update automatically when the underlying data changes. This enhances collaboration during reviews and allows decision-makers to explore different aspects of performance by simply clicking or dragging elements on the screen, making presentations more engaging and insightful.
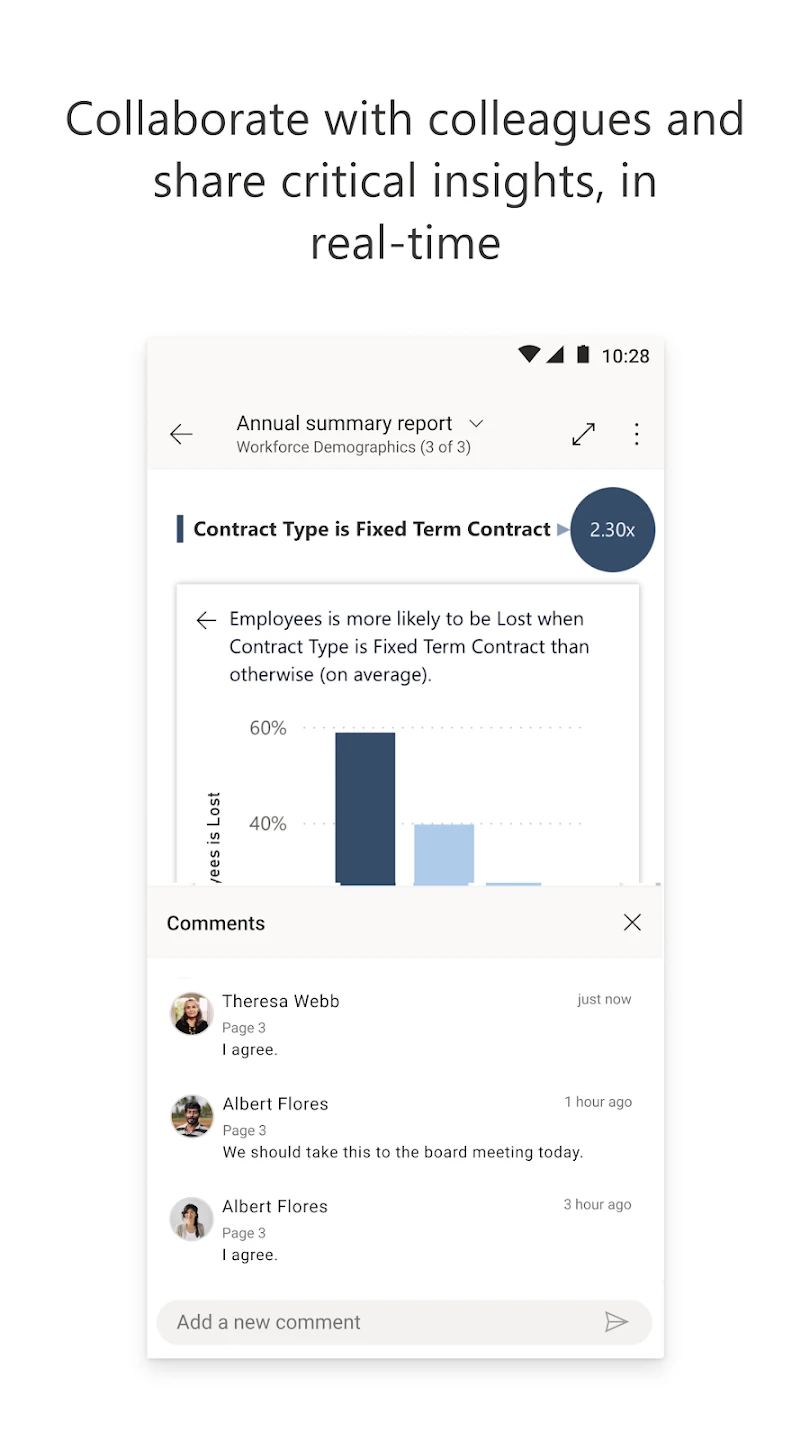
- Sharing and Collaboration Features: Publish reports and dashboards to the cloud or on-premises Power BI Service, granting specific view or edit permissions to individuals, groups, or the public via direct links or embedding. This facilitates seamless teamwork across departments and ensures stakeholders can access critical information in real-time, regardless of their physical location, accelerating informed decision-making.
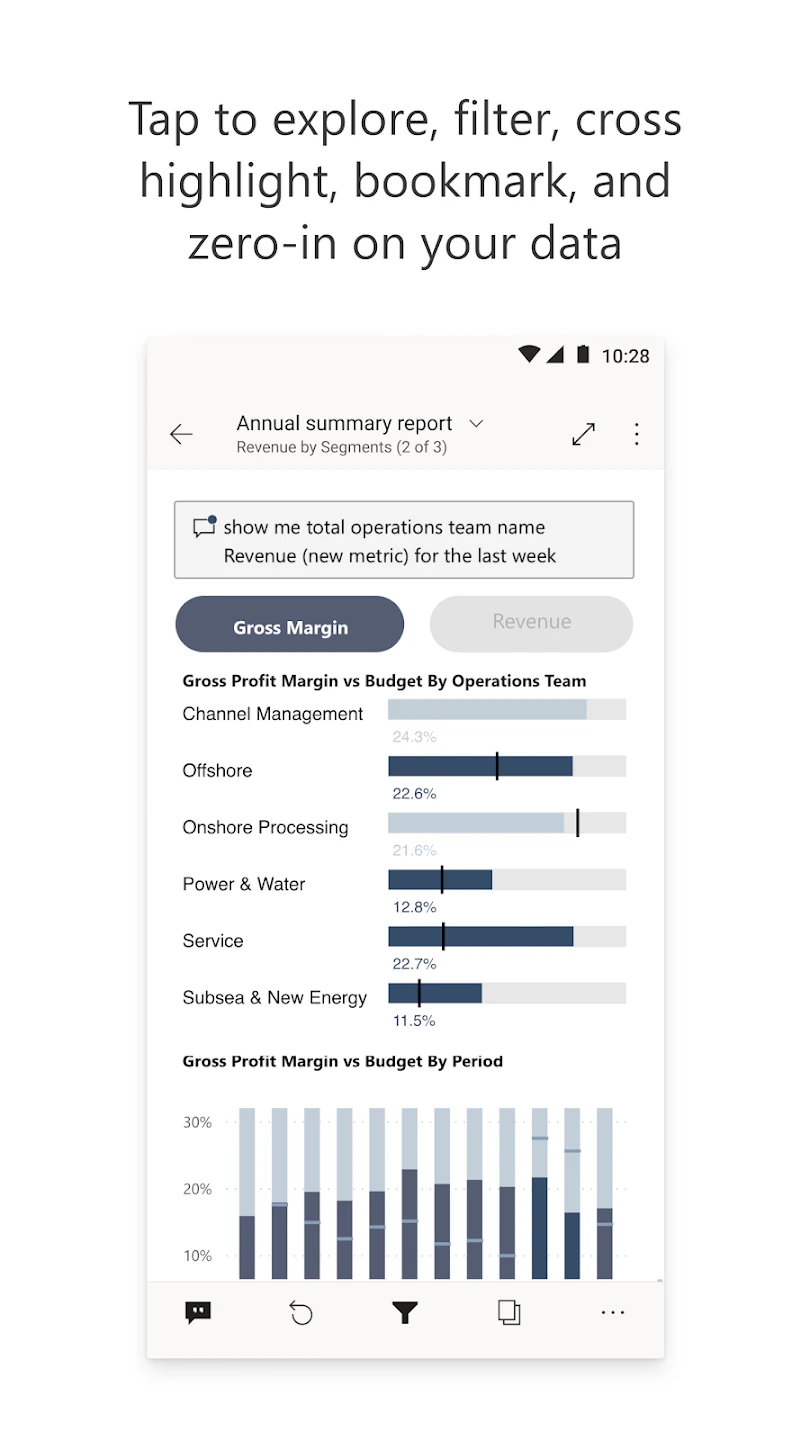
- AI-Driven Insights and Q&A: Leverage the AI engine to automatically detect trends, outliers, and significant changes, suggesting visuals and highlighting key findings. Users can ask natural language questions (e.g., “What were our sales trends last quarter?”) and receive instant answers and visualizations through the Q&A feature, significantly speeding up discovery for non-technical users unfamiliar with complex data structures.
- Publishing and Scheduling Reports: Automatically publish reports to the Power BI Service from within the application and schedule regular refreshes of data connections. This automates report deployment for IT teams or administrators, ensuring everyone always accesses the latest, most relevant information without manual intervention, maintaining data currency and consistency across the organization.
Pros & Cons
Pros:
- Comprehensive Free Tier Available
- Extensive Integration with Other Microsoft Tools
- Multilingual Interface and Global Accessibility
- Rich and Diverse Visualization Gallery
Cons:
- Data Refresh Speeds Can Be Slower for Very Large Datasets
- Advanced DAX Formulas Require Learning Curve for Power Users
- Premium/Pro Licenses Can Be Costly for Large Teams
- Mobile Experience Lacks Depth Compared to Desktop/Tablet Viewers
Similar Apps
| App Name | Highlights |
|---|---|
| Tableau |
Known for advanced visualization capabilities and powerful data blending features across multiple data sources. |
| Google Data Studio |
Offers free data visualization with strong integration into the Google Workspace suite and focus on web publishing. |
| Qlik Sense |
Provides associative BI engine and in-memory technology enabling users to discover insights through data exploration. |
Frequently Asked Questions
Q: Is there a cost associated with using Microsoft Power BI?
A: Yes, Microsoft Power BI offers a free version that is suitable for light usage. However, the Premium, Pro, or per-user plans have costs depending on the level of access, data storage, and advanced features like data refresh frequency or AI features.
Q: Can Microsoft Power BI connect directly to on-premise databases?
A: Absolutely, Power BI provides connectors and drivers for various on-premise data sources like SQL Server Analysis Services (SSAS), SQL Server Database, Oracle, and SAP systems, often requiring authentication to securely connect.
Q: How does Power BI handle large volumes of data?
A: Power BI can manage large data sets, especially when using DirectQuery mode for live data or Power BI Premium tiers for in-memory caching. However, performance depends on data size, complexity of queries, and the specific Power BI plan chosen.
Q: What happens if our data changes frequently, like real-time stock prices?
A: Power BI supports real-time or near real-time data refresh through DirectQuery mode or gateway connections to on-premise systems, allowing dashboards and reports to update automatically based on your schedule settings.
Q: Can I share my Power BI reports with colleagues outside my company?
A: Yes, reports and dashboards can be easily shared externally. You can publish them to the public web (with appropriate security measures), generate shareable links, or embed them directly into websites or Microsoft Teams channels, controlling the level of access granted to viewers or editors.
Screenshots
 |
 |
 |
 |
Microsoft Power BI App Download |
|
|---|---|
 |
 |